SCADA Systems and HMIs (Human Machine Interfaces) are essential to plant operations or any automation system as they provide the operator with visibility into the process.  As the name suggests, HMI/SCADA is the interface between a human and a machine; it bridges the gap between the operator and the plant that they are operating. It allows them to understand, control, and react safely and efficiently to the process that is currently occurring.
In the past, HMI/SCADA was used to provide the “Big Picture” or an overall representation of the plant, with limited capabilities of truly being able to monitor the process. With the advent of the DCS (Digital Control Systems), when graphics technology became readily available, designers tried to squeeze in so much information that it became a “Keyhole View”. This contributed to poor practices such as over alarming and poor graphic implementation: It encouraged poor operating practices. The data was not informative.
As graphics technology became more complex and advanced, these issues only 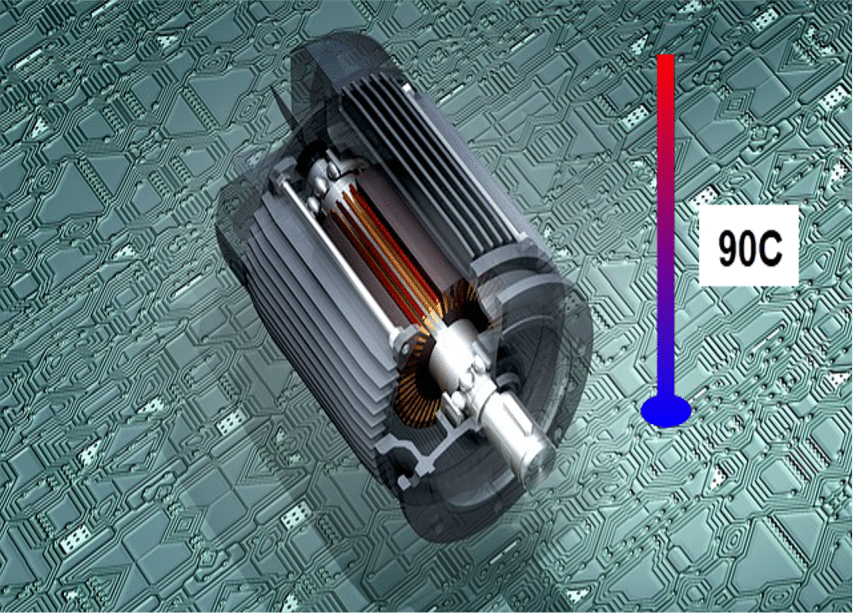 got worse. Only 10% of the screen was used to show poorly presented numeric data, and 90% was just a “pretty picture”. This approach created confusion, operator fatigue, and low situational awareness. Poor HMI/SCADA graphical design could cause the operator to miss vital information, lead the operator to make misinformed decisions, and may even cause serious accidents or malfunction.
To avoid such catastrophic situations, one must design good visualisation with the end-user in mind. User experience (UX) and Situational Awareness (SA) are two popular methodologies that achieve this. SA means that the HMI/SCADA design must easily make the operator aware of what is happening around them and the context of the information. E.g. 90°C is abnormal, but is the temperature increasing or decreasing? The operator needs to understand what the information means now (and in the past) and what it will mean in the future. Situational Awareness relates to the goals and objectives of a specific job or function – Context, Uptime, Yield, Rate, OEE (Overall Equipment Effectiveness) are all relevant concepts.
Designers and engineers form in their heads a different mental model of the process than an operator does. By understanding how operators select and use their goals, designers can better understand how information is perceived. Without understanding the user’s intent, the information presented will lack meaning.
Applying basic SA to HMI/SCADA graphics may include:
- Level 1: Providing schematic representation of the equipment with live numbers.
- Level 2: Providing the operator with the relevant information they need to understand how the plant is operating.
- Level 3: Providing trending data so that the operator can see how something is currently performing and help predict how it will perform in the future.
Levels 2 and 3 reinforce the operator’s mental model of the plant or process.
One clear example of how this discipline applies is described in the scenario below. It highlights that data is not information. The distinction between data and information is in the level of meaning that is provided.
Question: Is Sparky sick?

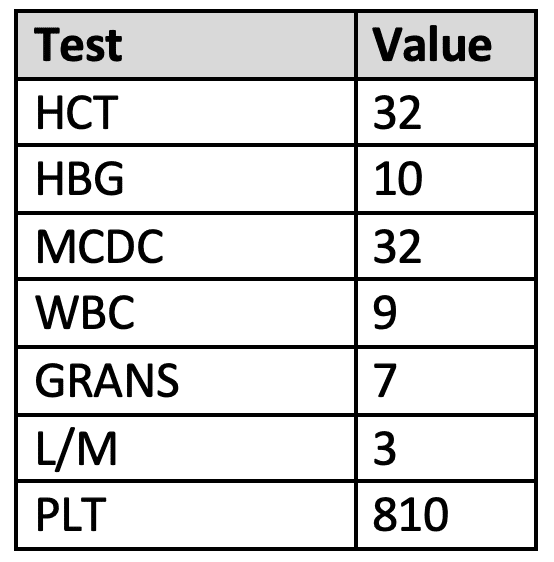
From the blood test results alone, you can’t tell if Sparky is well or not unless you are a vet. But with visualisation based on situational awareness, the data becomes meaningful, and one could quickly tell that Sparky’s health is mostly good, but there is an issue with PLT that needs to be investigated.
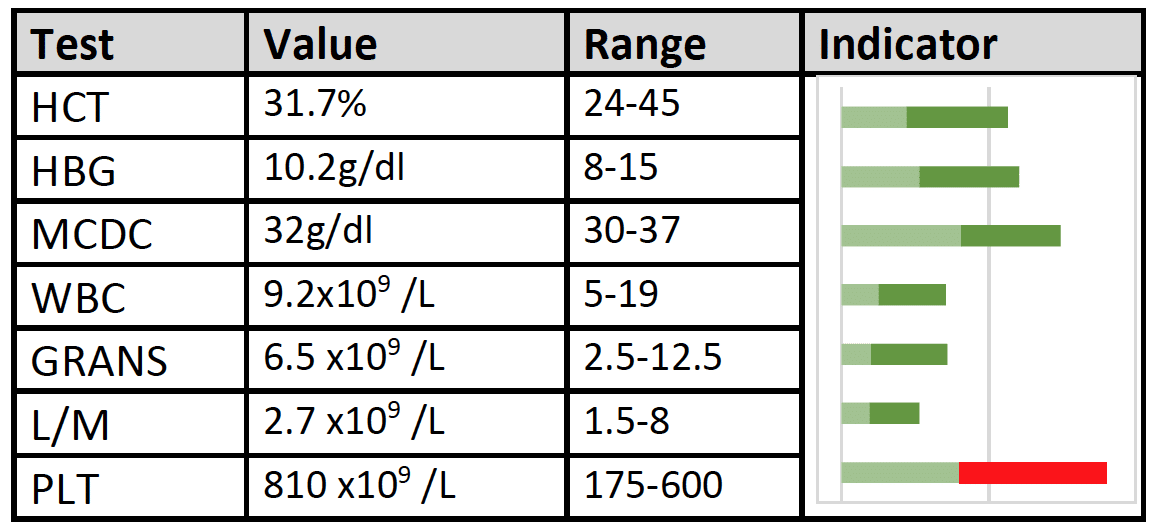
Indicators can change colour to highlight issues or dangerous levels.
What about in your plant?
Let’s talk about the plant process referring to the example above. An HMI/SCADA system that provides data without context puts the operator in a difficult situation. They must be deeply familiar with the process because they will be required to make value decisions based on what they consider normal and acceptable. The HMI/SCADA should turn the data into information by helping the operators to identify and understand what the data means. To this end, careful consideration needs to be given to the presentation. When the information is presented similar to the example of Sparky, an operator can review the entire process with a simple glance. They can quickly and easily identify that the process is entering dangerous levels, which part is at risk and why. They can react accordingly, hopefully before it is a major issue causing lost production.
Some additional guidelines on how to achieve good HMI design practices:
Do’s:
- Grey is in fashion – grey backgrounds, grey pipelines, grey vessels.
- Use low contrast.
- Avoid designs that use only colour coding or colour contrast to express information. This is particularly relevant for people who are colour-blind.
- Design the presentation to allow the operator to achieve their goals.
- All information shown should support comprehension of the process or plant.
- Represent performance data as trends (Level 3 SA).
- Attract attention to an area of the display that requires attention. Consider colour, size, and format.
- Only draw attention to an abnormal condition. A pump that is not running may not be an abnormal condition.
- Use status words that describe the digital condition, e.g. Running and Stopped rather than Run and Stop, which could be confused with command words.
- Be consistent.
Don’ts:
- Don’t decrease the operator’s situational awareness; this can occur when you go too far and make the operator feel he is out of the loop.
- Don’t use colour to represent normal states, e.g. red for stopped/closed or green for running/opened. Instead, use colour to represent what is abnormal.
- Don’t simply repeat engineering drawings (e.g. P&ID) as graphics.
- Hide data below several layers, requiring multiple clicks
- Don’t only provide one path to information (operators forget)
At Mescon, we have developed situationally aware graphics as well as graphics using the more traditional methods. Contact us to discuss how we can help you improve your window into the process and turn your data into information, making life easier for your operators.