The pressure is on. You must keep lead times short, meet target costs and keep a standard of quality. And that is just the tip of the iceberg! Who said manufacturing is easy? The last thing any production manager or supervisor wants is some form of production loss. But like a blowout in the family budget, production losses can be subtle and stealth-like, and before you know it, the damage is done. It would be easy to resign oneself to the problem by saying it’s too late now, but when it comes to performing your best in manufacturing, it is never too late and never too soon!
The identification of production loss is broadly based on a concept called “The Six Big Losses”. Initially written in 1971, Seiichi Nakajima of Japan’s Institute of Plant Maintenance and the author of the concept of Total Production Maintenance, Nakaima believed maintenance is shared by all employees and best done via small group activities to increase the efficiency and effectiveness of each machine. The Six Big Losses was created to identify and categorise productivity loss from the perspective of equipment used. As each loss relates directly to the OEE components, it complements the best practice of Overall Equipment Efficiency (OEE).
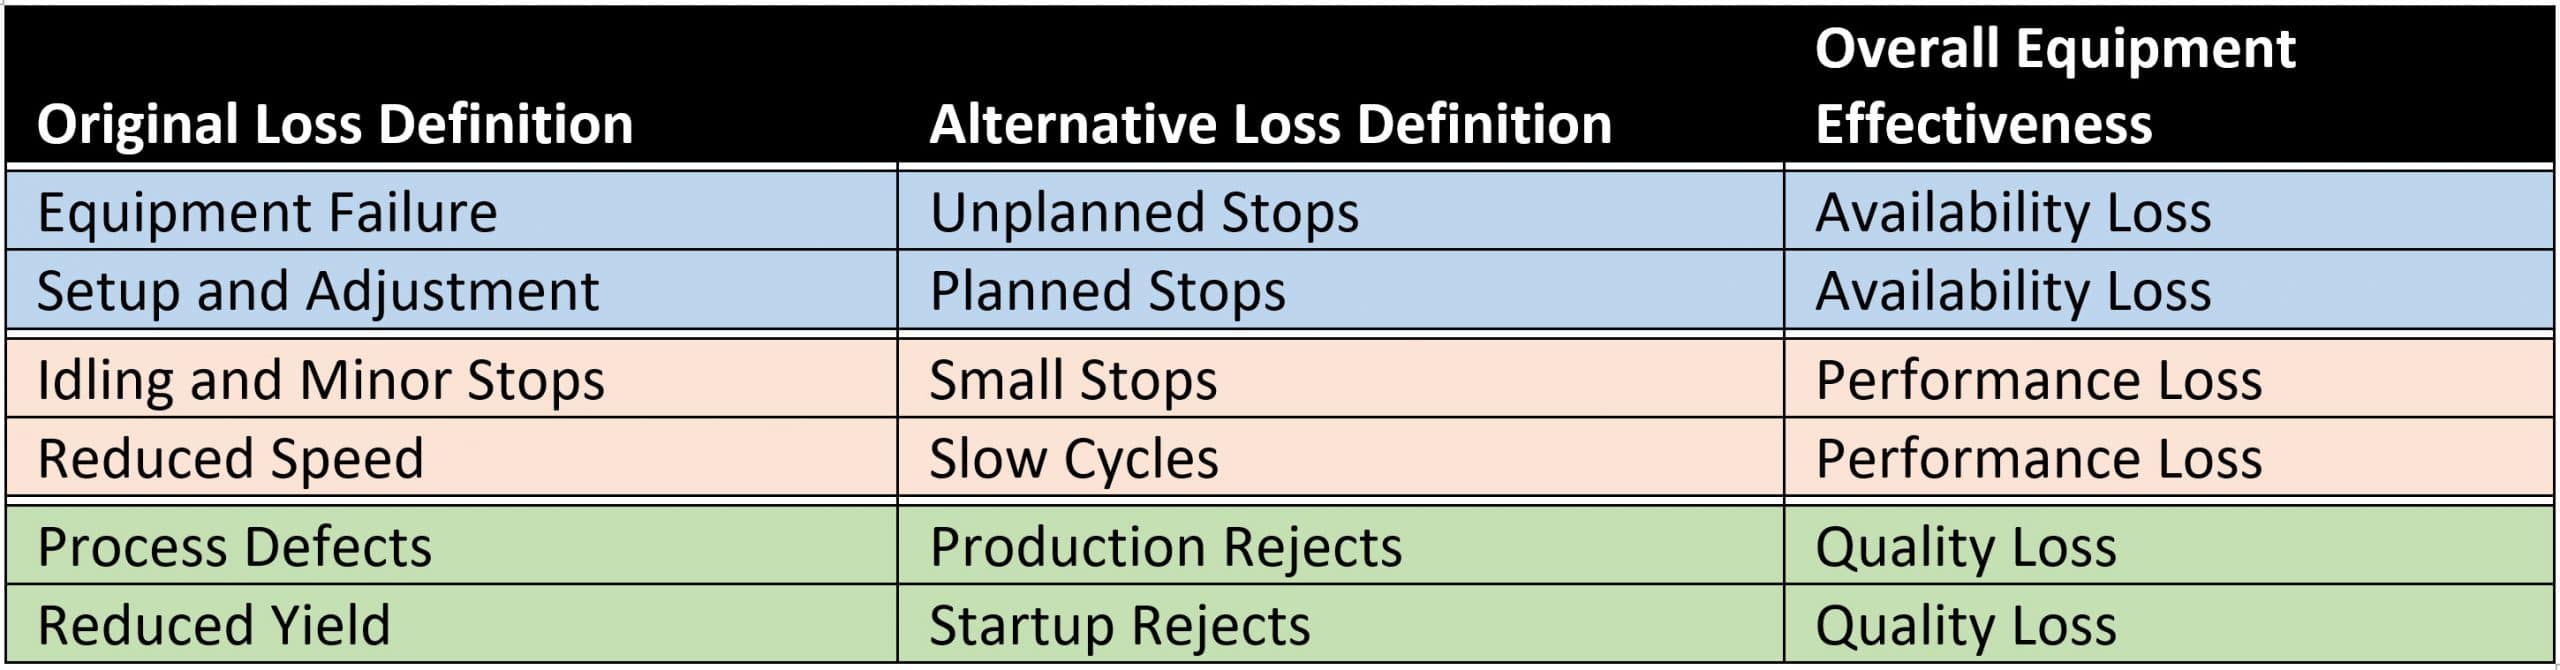
Traditionally, the Six Big Losses consisted of:
- Equipment Failure
- Setup and Adjustment
- Idling and Minor Stops
- Reduced Speed
- Process Defects
- Reduced Yield
As people have reflected on and applied the concept of the Six Big Losses, the losses have been renamed. In some instances, the new names probably better identify the reasons for production loss. In the table below, you can see the original and new definitions of losses and how they directly relate to the metrics used in OEE.
Why use Six Big Losses?
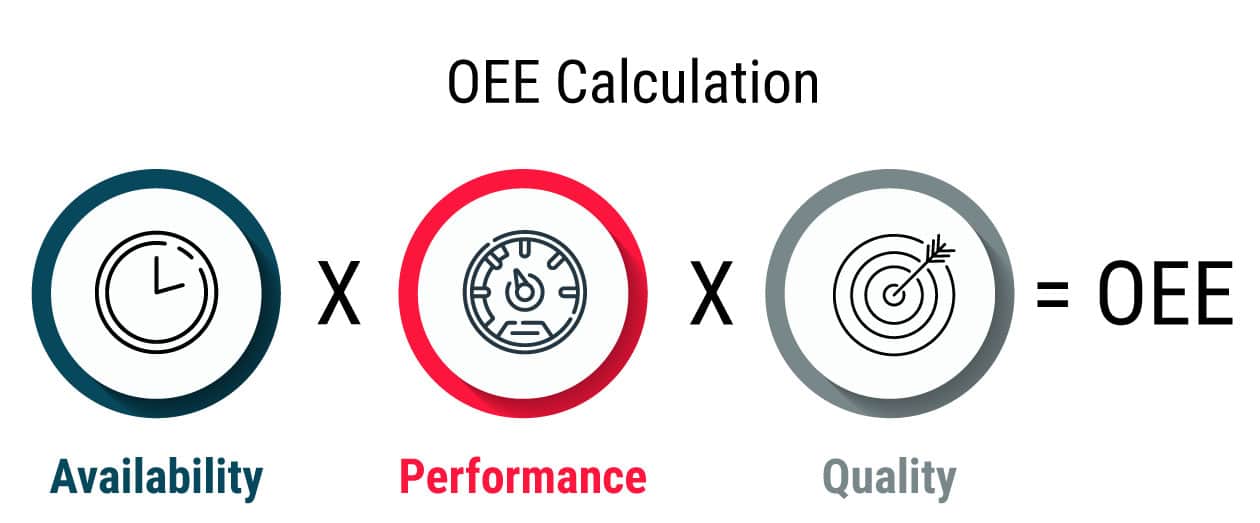
Every manufacturer wants to be more effective in what they do. There is a continuous goal of increasing output, driving costs, and retaining a high-quality product. In the quest to achieve this goal, many manufacturers have introduced OEE and have attempted to make the most of it. However, OEE is a high-level representation of what is going on. The end number of OEE may suggest that all is not well, but it offers no detailed information as feedback for improvement. As you can see from the formula below, OEE is just a set of numbers, a metric or KPI.
Using the Six Big Losses, a manufacturer can examine a production process and its related equipment, drill down on it and gain a more thorough understanding of what is or is not working. Meaningful data and feedback can be obtained to substantiate the figures used in an OEE calculation. As each loss relates directly to an element of OEE (see table above), it will help detail ‘the why’ of any low-figure OEE element.
Now that it can be seen how the concept of the ‘Six Big Losses’ enhances OEE, let’s take a deeper look at what it includes.
Availability Losses
Unplanned stops
Typically, an unplanned stop will be due to equipment failure – when a piece of equipment is meant to be up and running for production at a certain time but is not. Events such as equipment breakdown, unplanned maintenance and tool failure are some of the main reasons for unplanned stops. It is worth noting that unplanned stops may also be brought on by non-equipment failures such as a lack of operators, material shortage or material failure, and upstream/downstream blockages.
Planned Stops
A planned stop is, by definition, something that has been scheduled to take place and will include factors such as scheduled downtime, tool changeover, cleaning, breaks or meeting times, scheduled maintenance, and quality inspections.
Performance Loss
Small Stops
A small stop is typically a minute or two, but some manufacturers will consider a stop of up to 10 minutes to be a short stop. It is a stop that the operator resolves. Unfortunately, small stops can be chronic due to the same issue recurring or other problems occurring. While small stops may seem insignificant, the total number of stops may have quite an impact. Situations such as misfeeds and material jams, blocked sensors, or incorrect settings will contribute to small stops.
Slow Cycles
If a machine is not running to its rated or ideal cycle time, it can be classified as a slow cycle. Often worn, faulty or even dirty equipment will contribute to a slow cycle time. Contributors to slow cycle times don’t have to be just mechanical reasons. Environmental conditions or operator inexperience can contribute to a slow cycle time.
Quality Loss
Production Defects
A production defect is defined as any part or product manufactured during production that must be scrapped or reworked because it does not conform to the quality standard and thus contributes to quality loss. Defects can be due to wrong settings, operator error, or lot expiration (e.g. Pharmaceutical). This category of loss assumes that the production cycle is steady and stable, and running properly.
Startup Defects
Any defective parts created from the period of startup or warm-up, before running in a steady state, are known as startup defects. Variations in a process, such as a tool or material changeovers, can often contribute to this loss. In warming cycles such as glue heating, where optimum conditions have yet to be reached, startup defects will likely be experienced.
Now that you have a better understanding of these ‘big’ losses, it is important to capitalise on them. Making the effort to measure and record where your manufacturing processes are creating a loss will enhance any OEE measures already in place. Knowledge from the six big losses will not only complement OEE but will extend the insights gained. From it, you can identify countermeasures or remedies for longer-term benefits. You will also have confidence about the state of your processes and, hopefully, be freed to focus on other areas of improvement.
If you are not sure about where to start or what you need to do next, one of our team would be more than happy to assist you. Don’t put off today’s savings until tomorrow!